My colleague Richard Pink had the idea of illustrating the matrix I had found with F. Jouve and D. Zywina, whose characteristic polynomial has Galois group W(E8), by plotting it on a grid with colors to indicate the size of the coefficients. This representation was then constructed by Leopold Talirz using Matlab, with the following result:
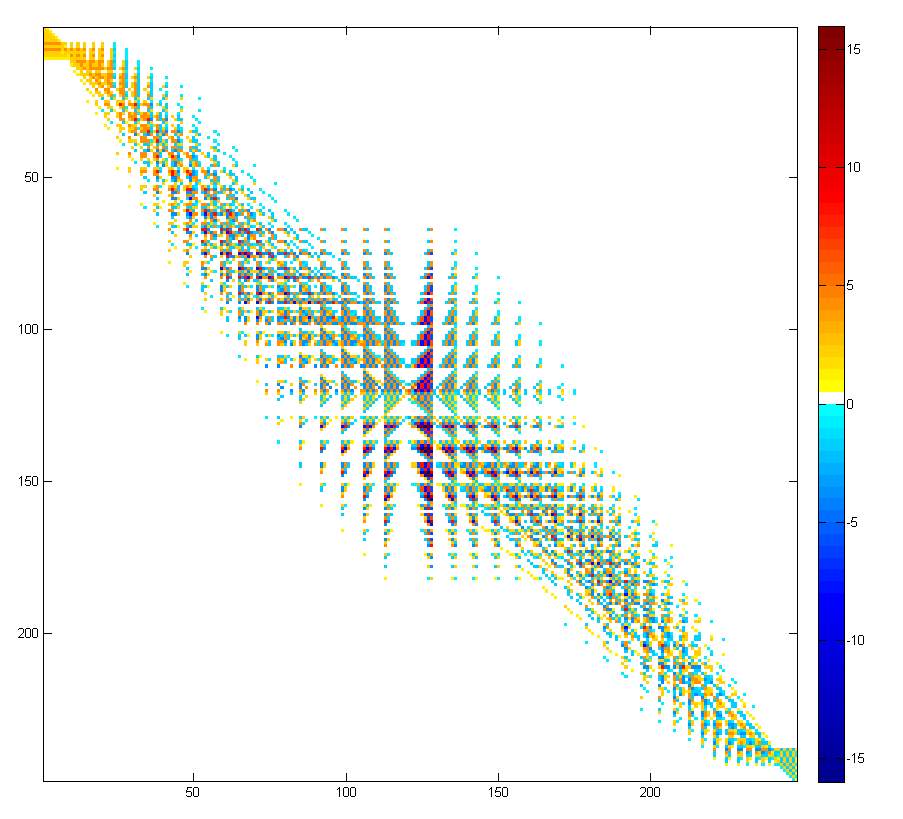
The square grid represents the matrix graphically, and the scale for colors is indicated on the right. I think this is an intriguing picture. Can anyone suggest an explanation for its structure? In fact, since the matrix arises by a product
$latex m=x_1x_2\cdots x_{16}$
it would actually probably be even more interesting to show the evolution of the matrix from the identity as more terms are added in the product (and even to continue beyond this matrix in a random walk, as this the motivation for the construction…). If this leads to a nice result, I’ll post it later…